
Getting started
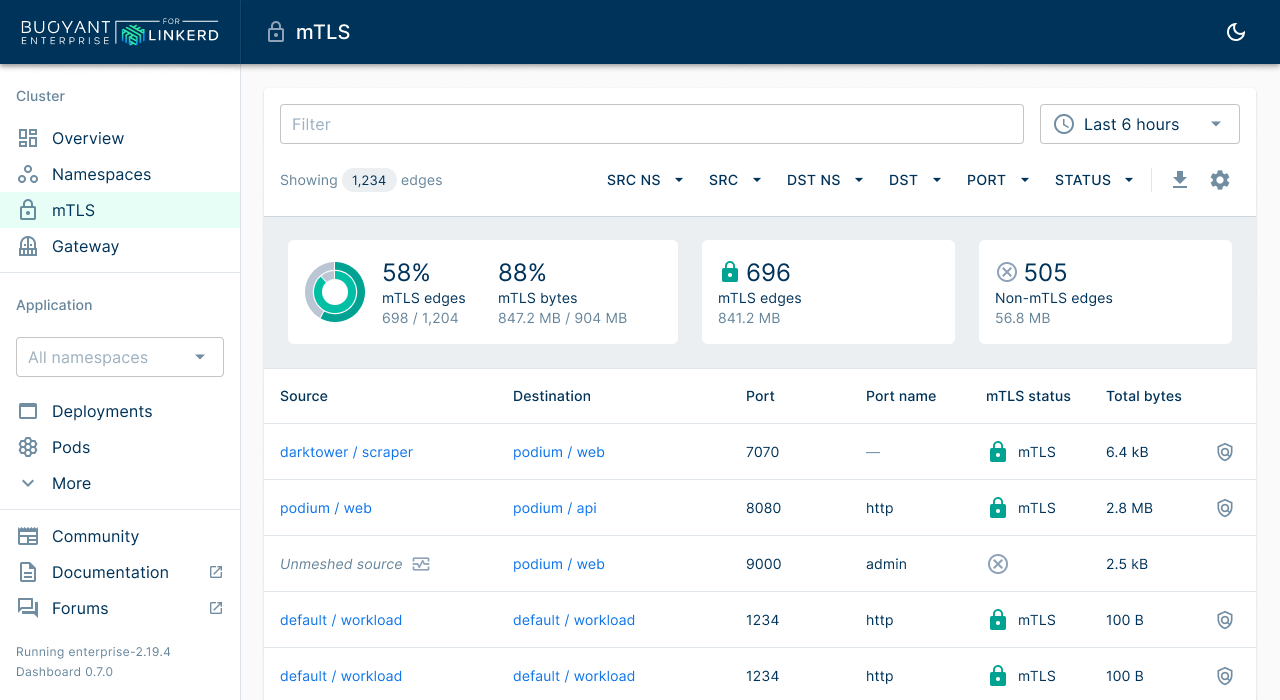
Buoyant Enterprise for Linkerd (BEL) provides a user-friendly dashboard for monitoring and managing your Linkerd service mesh within a cluster.
With the dashboard, you can:
- Monitor the health of the Linkerd control plane.
- View key performance metrics (“golden metrics”) for all meshed workloads in your cluster.
- Visualize traffic flow between workloads with an interactive traffic chart, making it easy to identify issues within your service call chain.
Prerequisites
- Buoyant Enterprise for Linkerd installed on your cluster
Metrics pipeline
The dashboard ships with a built-in Prometheus instance that is configured to scrape all Linkerd proxies on the cluster and store that data for 6 hours. This instance is intended for demo and getting-started purposes only and is not suited for production use.
For production deployments, provide your own production-ready Prometheus instance. Also note that this instance may consume a large amount of memory, depending on the size of your deployment. Please monitor your deployment carefully.
Installation
The dashboard is managed via a Helm chart. To install or upgrade to the latest stable version, run:
helm upgrade -i -n monitoring --create-namespace \
    linkerd-dashboard oci://ghcr.io/buoyantio/charts/linkerd-dashboard
Setting a base URL: If you do not want to run the dashboard at the root, use
the same command as above and set the baseUrl value, for example:
--set baseUrl=/dashboard.
Accessing the dashboard
To access the dashboard, forward port 8080 from the dashboard workload:
kubectl -n monitoring port-forward deployments/linkerd-dashboard 8080 &
Then, open your browser and navigate to http://localhost:8080.
Multi-cluster configuration
If you have installed BEL’s multi-cluster extension, follow the guide to configure multi-cluster policy for the dashboard.
FIPS support
The dashboard will communicate using FIPS-validated cryptographic modules when used in conjunction with BEL FIPS support.